Home / Coastal modelling / Case studies
Modelling case studies

What our modelling has found

Every job starts with a question about a real coast. Here is what we were asked, what we did and what the model showed, from resort beaches in the Caribbean to a monsoon coast in India. Many of our clients are private, so we describe them by type and region.

16modelling studies on this page
6countries, from Mexico and the Caribbean to Israel and India
In-houseHigh-performance CFD, SPH, coastal and stochastic models, validated against SWAN, TELEMAC and XBeach
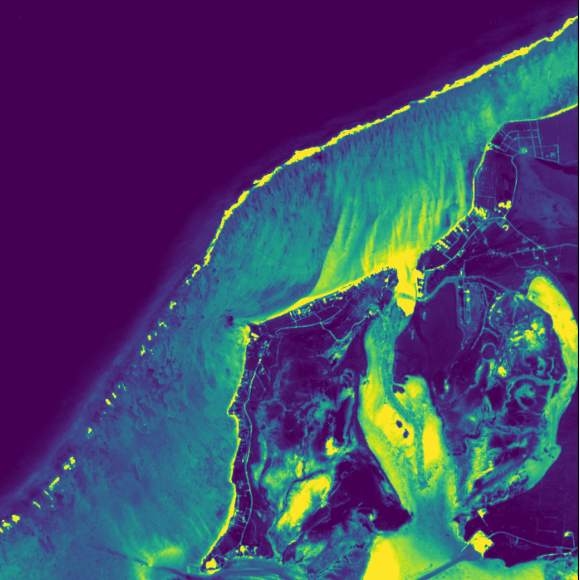
Satellite-derived map of the seabed and shallows at the Turks and Caicos site
Turks and Caicos Islands - 2025-26

Placing a reef on a hurricane coast

Island resort

The question: Where can a reef go to hold the beach in front of a resort exposed to hurricanes and storm surge, and what would it change?

What we did: A field survey with boat-mounted sonar bathymetry, beach profiles, sand depths and tide records. Joint extreme-value statistics of offshore waves (Heffernan and Tawn) with environmental contours, then nearshore SWAN and TELEMAC modelling of bed shear and sand movement.

What we found: A map of where sand is moved and lost under everyday and extreme seas, giving a reef position and an assessment of its effect on the beach and seabed.

Sonarbathymetry survey
Jointextreme statistics
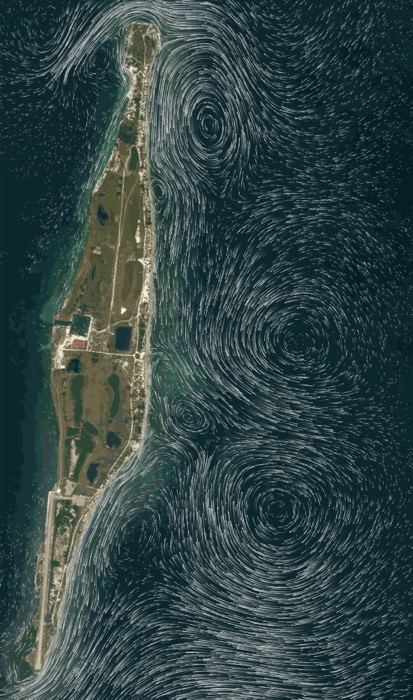
Figure neededCFD snapshot of a wave passing over the reef, or the extreme-value fit
Netanya, Israel - 2024-25

Designing a reef for the Mediterranean

National coastal cliff protection company

The question: What waves must a hyperboloid reef off Netanya survive, and how should it be anchored?

What we did: Bathymetry combined from national surveys, GEBCO and charts. Four wave datasets compared (NOAA, Copernicus and two local buoys), a SWAN nearshore model and a stochastic extreme-value model, reviewed with Imperial College London. CFD of wave loads on the reef, FEM of the steel with and without rock growth, and anchor capacity from local borehole logs, all taken through a critical design review.

What we found: Design loads, forces and overturning moments for waves up to 2 m, structural checks for the reef before and after rock has grown, and an anchoring scheme matched to the seabed.

4wave datasets compared
CFD + FEMreef design
Figure neededWave rose and nearshore wave height map
Playa del Carmen, Mexico - 2024

Modelling a beach recovery

Beach club

The question: Can a reef bring back an eroding beach on the Riviera Maya, and what must it be designed for?

What we did: Tidal range, mean and extreme wave roses, and NOAA and Copernicus hindcast extremes, with nearshore SWAN and TELEMAC models over GEBCO bathymetry.

What we found: Design conditions for a reef in about 2 m of water, 50 m from the shore, for waves of 1.2 m and 6 s. The study fed straight into the environmental impact statement for the permit.

50 mfrom shore
Permitapplication supported
Figure neededMonsoon wave rose
Kerala, India - 2024

A monsoon coast in front of a terminal

Energy terminal, with Terre Armée

The question: Could a reef stop monsoon waves eroding the beach and overtopping a 700 m boundary wall?

What we did: Wave climate analysis from ERA-Interim and NOAA data, with wind and wave roses, and a phased approach starting with paid site diagnostics. Steel and bamboo reef options were compared.

What we found: A target of 30-50% less energy in the largest waves, with reduced longshore currents and sediment from the nearby river delta drawn back onshore.

700 mwall to protect
30-50%target wave reduction
Figure neededComparative nearshore wave model, with and without the reef
Ixtapa-Zihuatanejo, Mexico - 2023-24

Stabilising a pocket beach

Resort development

The question: Bigger swells had steepened and eroded a pocket beach on the Pacific coast. What would hold it?

What we did: Background research, offshore wave and wind statistics and their correlation, extreme cases, bathymetric and comparative nearshore modelling, and CFD of the CCell reef, delivered with AxisIMA.

What we found: Options compared for sand bypassing, wave control with a reef, and maintenance, with dredging volumes, leading to a second phase of work.

CFDof the reef
Phase 2commissioned
Figure neededSatellite shoreline comparison, 2003 to 2022
Guerrero, Mexico - 2023

Twenty years of a bay from space

Bay on the Pacific coast

The question: Why is one end of the bay eroding while the rest is stable?

What we did: Shoreline change mapped from satellite images from 2003, 2018 and 2022, with a SWAN wave analysis over GEBCO bathymetry.

What we found: The north and middle of the bay have been stable for 20 years, while the south is in permanent erosion: oblique waves drive sand north, and the drift grows with wave energy.

20 yearsof shoreline
3satellite epochs
Figure neededBeach width then and now
Tulum, Mexico - 2023

A beach a third of its old width

Boutique hotel

The question: How fast is a 1 km beach between two headlands disappearing, and what would bring it back?

What we did: A diagnosis of beach change with AxisIMA, and a method and schedule for a wave-reducing living reef with beach recovery.

What we found: The dry beach had narrowed from 30-35 m to 10-12 m in 20 years, a retreat of about a metre a year.

~1 ma year lost
1 kmof beach
Figure neededMonthly wave height statistics
Goa, India - 2023

A reef instead of a breakwater

Training jetty, with Terre Armée

The question: A new jetty needed shelter, but concrete and quarried stone were restricted. Could a reef do the job?

What we did: Offshore and nearshore wave statistics, with monthly fits of wave height, and a feasibility note on a reef alternative.

What we found: A reef about 250 m long in 1-5 m of water could keep waves at the jetty to 1 m or less, with a 20-year design life.

250 mreef
1 mor less at the jetty
Figure neededWave height behind the reef, or the reef layout
Los Cabos, Mexico - 2023

A calm swimming area on an open beach

Luxury resort

The question: Can a beach facing the open ocean be given a calm, safe area for guests?

What we did: A survey of beach profiles and bathymetry with AxisIMA, then reef design and a comparison of hyperboloid reef structures with a conventional breakwater, with a 1:20 laboratory test plan.

What we found: A 3 m high submerged reef about 50 m offshore was viable, possibly with a pier on top to extend the calm zone. Permits and hurricane exposure were the main risks.

3 msubmerged reef
50 moffshore
Figure neededPhoto of the flume tests, or attenuation against freeboard
Imperial College London - 2023

Testing reef shapes in a wave flume

For the Netanya programme

The question: How do a reef's porosity and height below the surface change how much wave energy it removes?

What we did: A 2D physical model in the coastal flume at Imperial College London, testing reef porosities of 80, 50 and 30% at different depths and measuring anchor loads.

What we found: The best surface porosity was 0-20%, internal porosity mattered little, and the reef crest should be within about 0.5 m of the surface. Two reefs in series removed up to 40% more of the shorter waves.

Up to 40%more with two reefs
<0.5 mideal crest depth
Figure neededSPH load simulation, or the reef on the seabed
Netanya, Israel - 2023

A winter at sea for reef anchors

National coastal cliff protection company

The question: Will sand anchors hold a reef through a Mediterranean winter?

What we did: Wave and structural analysis, SPH simulations of return-period loads and anchor design, then a short reef of four bolted units (1.4 t with ballast standing in for rock growth) on 20 anchors, monitored and recovered.

What we found: Three of the ten vertical anchors hit rock below the sand and could not be fully driven. That is why our designs now start with a detailed sand-depth and borehole survey.

20sand anchors
1.4 ttest reef
Figure neededWave energy with and without the reef
Sisal, Yucatan, Mexico - 2021

Sizing a kilometre of reef

Residential development

The question: How much would a reef reduce the waves reaching the beach, and how could it be built in stages?

What we did: NOAA wave data and wave propagation modelling over surveyed beach profiles, with and without the reef, plus cost options for staged deployment and transport.

What we found: The reef would cut wave energy by 30-40%. A 150 m pilot was proposed as the first stage of a 1 km, 263-unit reef.

30-40%less wave energy
1 kmfull reef
Modelled current streamlines around an island
Belize - 2021

Waves and currents around an island

Private island

The question: Would a planned set of breakwaters and groynes stop the island's beaches washing away?

What we did: A review of the existing coastal works design, then wave propagation, wave-driven currents and about 10 years of shoreline change modelled around the bay beaches.

What we found: The island's north and south tips drive most of the sand loss, and the planned gap between groyne and breakwater was too large. Two offshore reefs were proposed instead.

10 yearsof shoreline change
2offshore reefs proposed
Figure neededWave-driven current map
San Miguel, Yucatan, Mexico - 2021

Why the geotubes did not work

Homeowners' association

The question: After mixed results from geotubes, what is really moving the sand?

What we did: Wave roses propagated to the shore and wave-driven currents modelled along the coast.

What we found: A strong east-to-west longshore current on an oblique shoreline, which any solution has to work with rather than against.

Longshorecurrents mapped
~25homeowners
Aerial survey of Telchac Puerto showing sand building up behind the reef
Telchac Puerto, Yucatan, Mexico - 2020-22

From wave model to working reef

Homeowners and the municipality

The question: Where should a 130 m reef go to protect an eroding beach, and did it work?

What we did: NOAA wave data from 2005 to 2018 and SWAN wave propagation, reef positioning studies and site surveys, with a simulations report that supported the environmental approval. Beach profiles were then surveyed after installation.

What we found: Within six months of the reef going in, the beach behind it had gained about 181 m² of sand against 70 m² lost.

181 m²sand gained
2005-18wave data modelled
Read the full story
Figure neededXBeach comparison of reef layouts
Quintana Roo, Mexico - 2020

Testing reef layouts in a protected area

Beachfront properties in a biosphere reserve

The question: Inside a coral barrier reef, in 3 m of water, what reef layout would stop the beach eroding?

What we did: XBeach simulations comparing the reef's distance from shore, straight and angled layouts, and permeable and solid reef types, with a review of the environmental permitting route.

What we found: A reef about 100 m long, roughly 70 m from shore, gave the best protection for the beach.

XBeachlayout tests
100 mreef
Your coast next

Have a question about your coast?

Tell us what is happening to your shoreline, or what your project needs, and we will tell you what modelling would answer it.